Custom KProbe Monitoring Tool
Overview
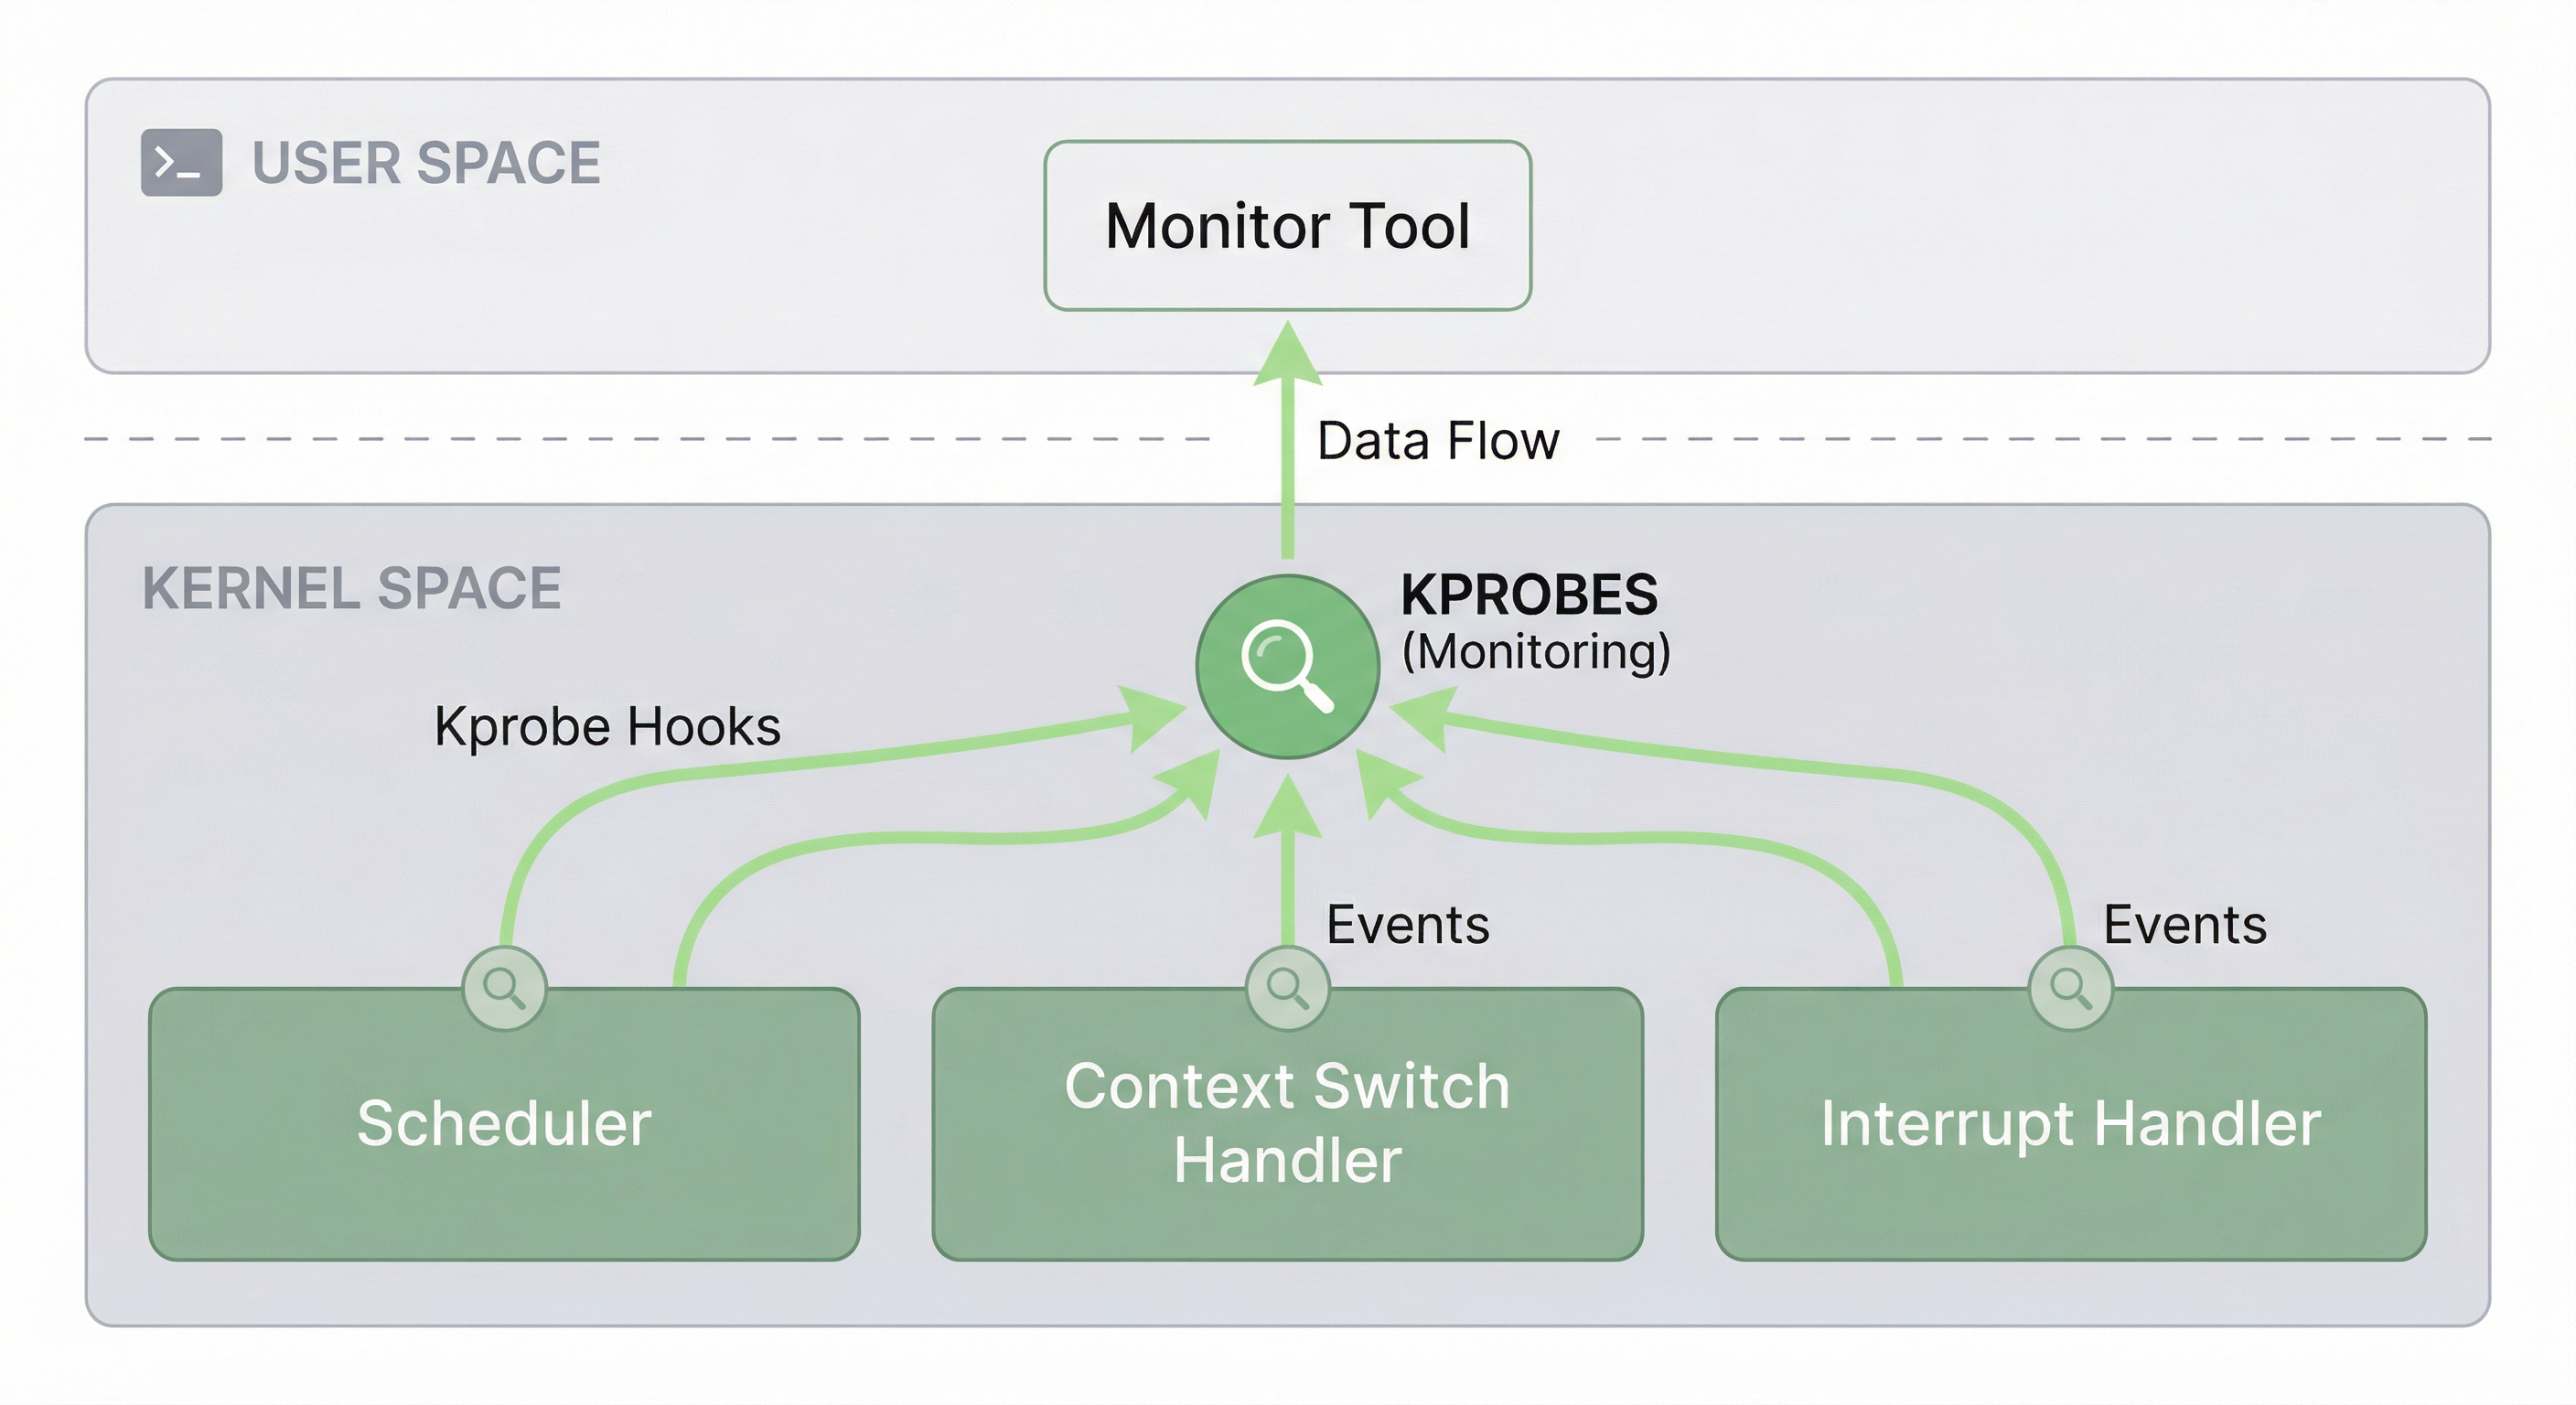
A custom kernel monitoring tool built using Linux kprobes to gain deep insights into kernel behavior, scheduler decisions, and system performance characteristics.
Features
Context Switch Monitoring
- Tracks all context switches in real-time
- Measures time spent in each process
- Identifies processes causing excessive switching
- Histogram generation for switch frequency analysis
Interrupt Call Tracking
- Monitors hardware and software interrupts
- Measures interrupt handling latency
- Identifies interrupt storms and bottlenecks
- Per-CPU interrupt distribution analysis
Job Scheduler Simulation
- Simulates CFS (Completely Fair Scheduler) behavior
- Virtual runtime tracking for processes
- Red-black tree visualization of runqueue
- What-if analysis for scheduling decisions
Implementation Details
KProbe Architecture
static struct kprobe kp = {
    .symbol_name = "finish_task_switch",
    .pre_handler = handler_pre,
    .post_handler = handler_post,
};
Data Collection
- Ring buffer for low-overhead event storage
- Per-CPU buffers to avoid contention
- Efficient binary format for trace data
- User-space tools for analysis and visualization
Virtual Runtime Tracking
- Maintains shadow scheduler state
- Calculates expected virtual runtime
- Compares with actual kernel decisions
- Identifies scheduling anomalies
Use Cases
- Performance Debugging: Identify scheduling bottlenecks
- Latency Analysis: Measure and reduce system latency
- Workload Characterization: Understand application behavior
- Educational: Learn kernel internals hands-on
Technical Stack
- Kernel Module: C with kprobe API
- User Tools: Python for analysis
- Visualization: Custom plotting tools
- Tested on: Linux 5.x kernels